From reactive to predictive: how continuous vision is rewriting utility operations
Two utility deployments — VA SYD in Sweden and EMASESA in Seville — show what changes when asset inspection becomes continuous: fewer truck rolls, faster response, and visibility for assets that used to be invisible between visits.

Mattias Nahlin
Chief Strategy OfficerThe blind spot that utilities have lived with for fifty years
Ask any water utility how they keep an eye on their most distributed assets — stormwater grates, inlet chambers, overflow walls, pumping stations, meters — and the answer has barely changed in half a century: send a van, on a fixed schedule, and hope nothing breaks in between.
It’s a model that’s expensive, reactive, and wasteful in ways nobody notices. Trucks roll whether or not the asset needs attention. Most inspections reveal no required action. And between visits, assets can fail silently for weeks — sometimes with real downstream consequences like flooding, overflows, or lost water.
The underlying problem is a visibility gap. Utilities run thousands of geographically distributed assets, and the tools available to monitor them have forced a choice between “inspect everything occasionally” and “react when something has already gone wrong.” Neither scales with the ambition of a modern utility.
Continuous, low-cost visual monitoring changes that equation. And two recent deployments — one in Sweden, one in Spain — show what happens in practice.
A new thesis: continuous visibility at network scale
The combination of battery-powered sensors, embedded connectivity, and ultra-light AI training has collapsed the cost and complexity of remote monitoring. Utilities no longer have to reserve visibility for their most critical assets — they can extend it across the whole network.
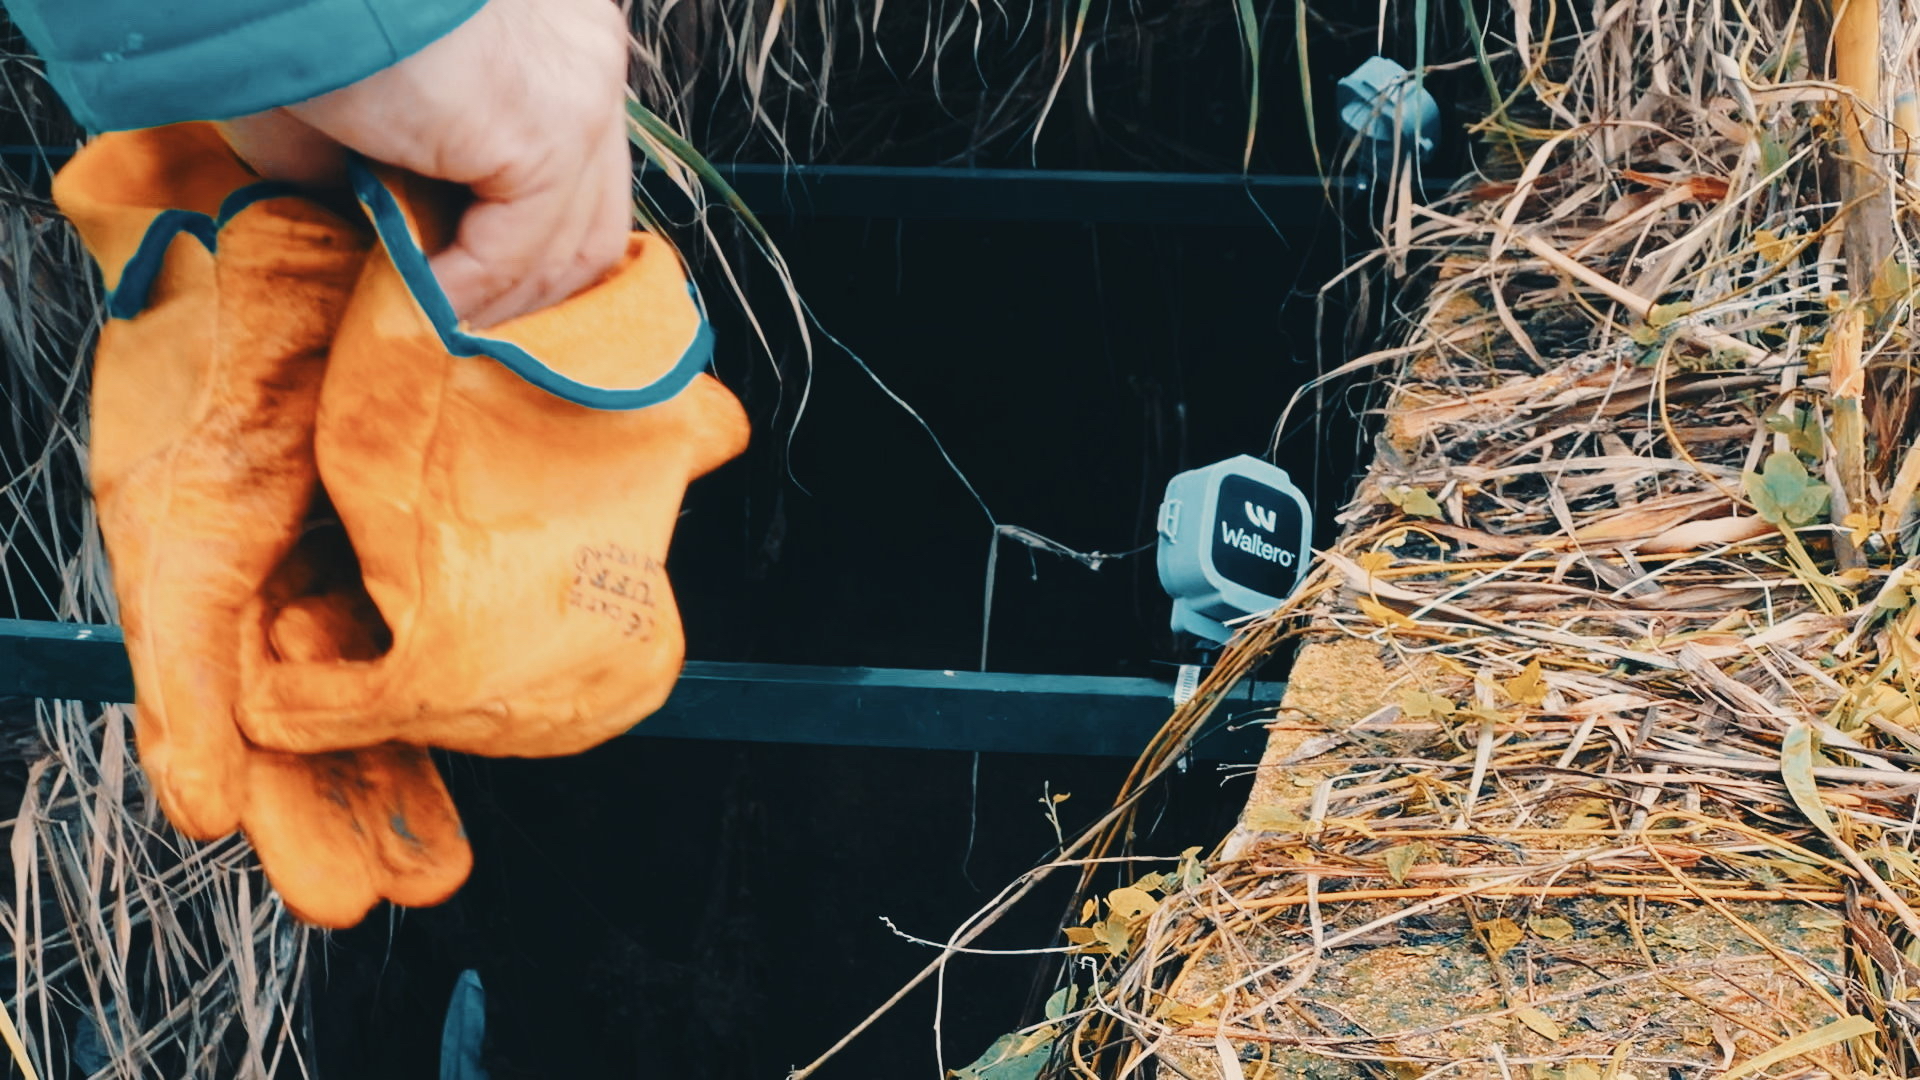
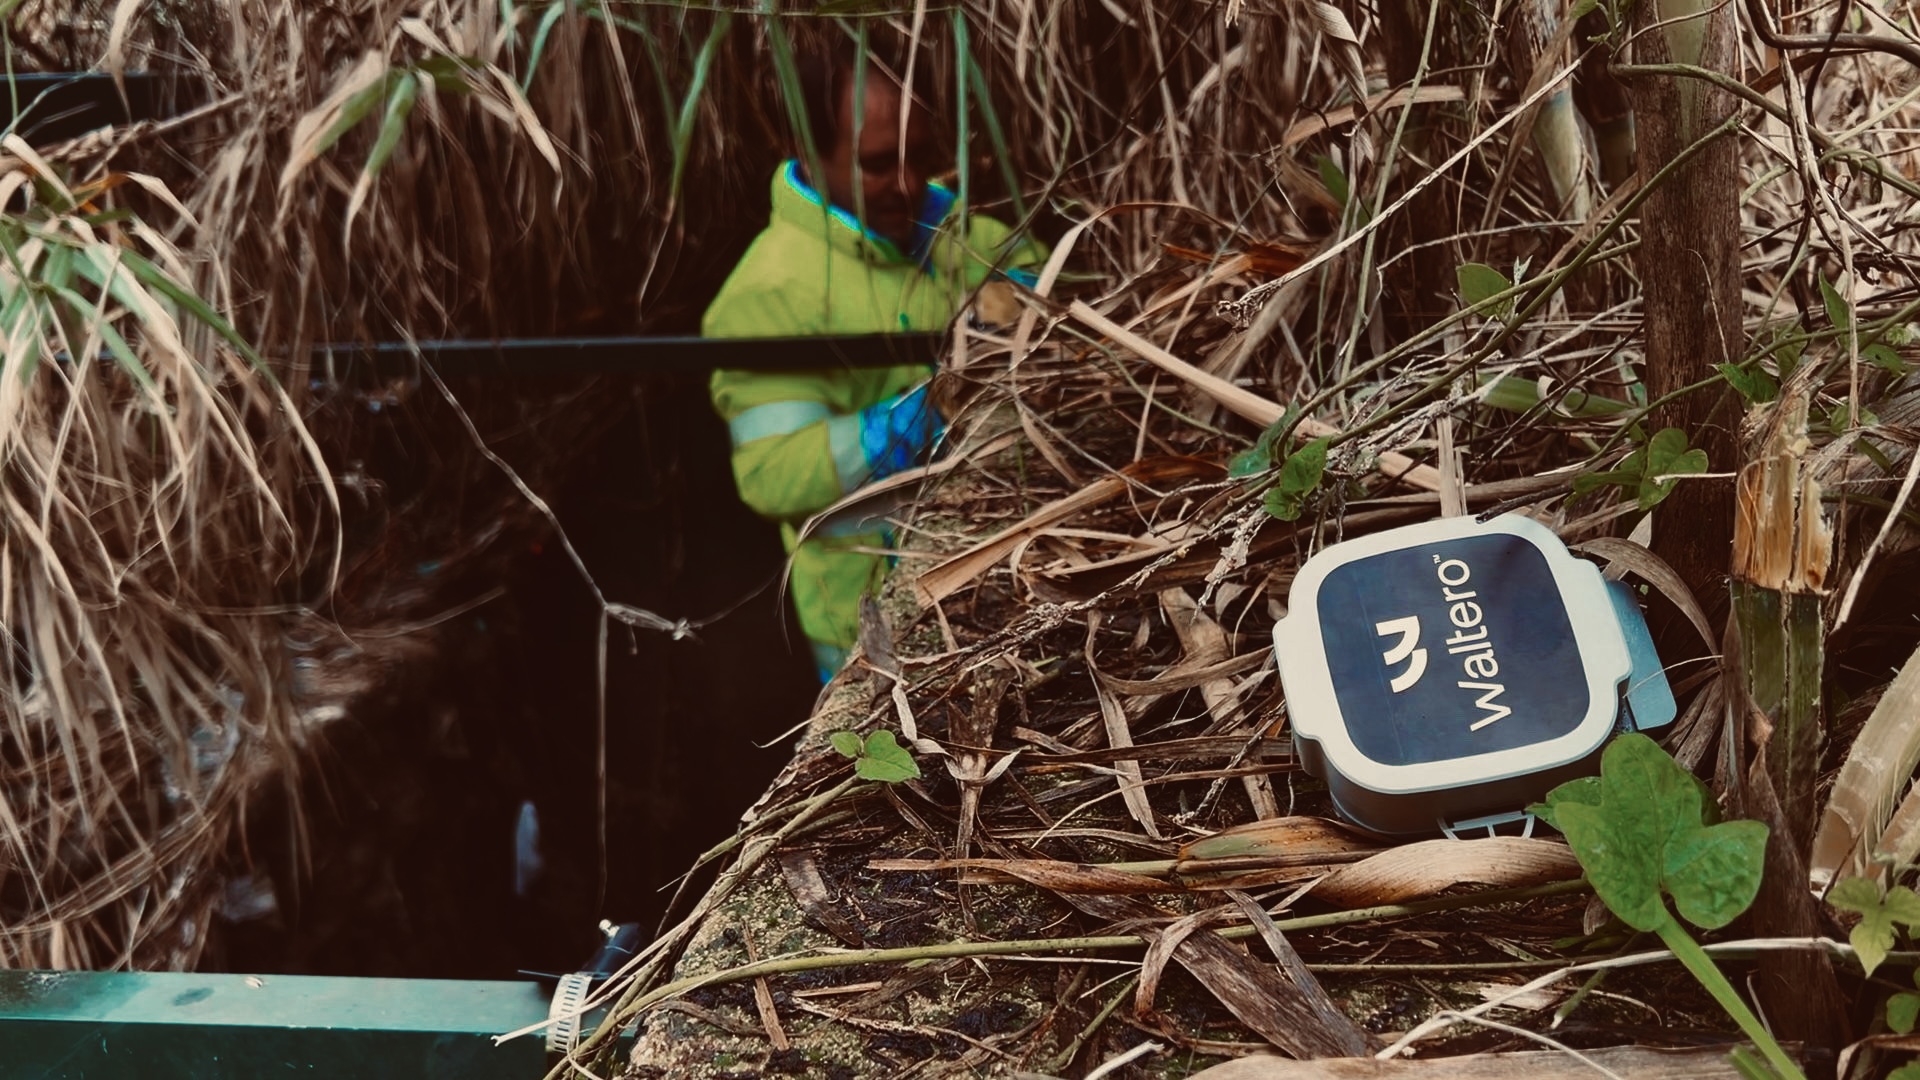
In plain terms: a sensor that mounts in hours, needs no mains power, no wiring, and no IT integration. It captures images and telemetry on a schedule, and AI scores the condition of the asset directly from those images — trained on just a handful of examples from each location. Field crews are dispatched only when the data says they should be.
The outcome isn’t more reporting. It’s fewer trips, faster response, and condition data across assets that used to be inspected only when something broke.
Case study — VA SYD, Sweden: 66% fewer site visits
VA SYD is a regional water and wastewater utility serving multiple municipalities across southern Sweden, with an extensive network of distributed water-inlet facilities requiring scheduled inspection.
The challenge was familiar: routine inspections were costly, field-crew time dominated the operating budget, and most visits revealed nothing that needed action. Meanwhile, water loss and unplanned downtime continued to bite.
After deploying W-Sensors at scheduled water-inlet facilities, continuous camera-based monitoring via the Mimir platform replaced in-person rounds. Two-thirds of scheduled inspection trips were eliminated — not by cutting corners, but by cutting the empty trips.
That’s the real shift: the same assets, better watched, at a fraction of the operational cost.
Case study — EMASESA, Seville: visibility at scale
EMASESA is Spain’s fourth-largest water utility, serving around 1.2 million consumers across the Seville metropolitan area. They operate thousands of distributed stormwater assets, regularly blocked by wet wipes, litter, and organic debris — with flooding consequences when blockages go undetected.
Manual inspection across a network that size is not just expensive. It’s impractical at that scale.
In a 15-day pilot, EMASESA installed sensors at two representative sites to stress-test different use cases: back-flow plus grate monitoring at Felipe González, and a primary-and-back grid configuration at Las Aseñas.
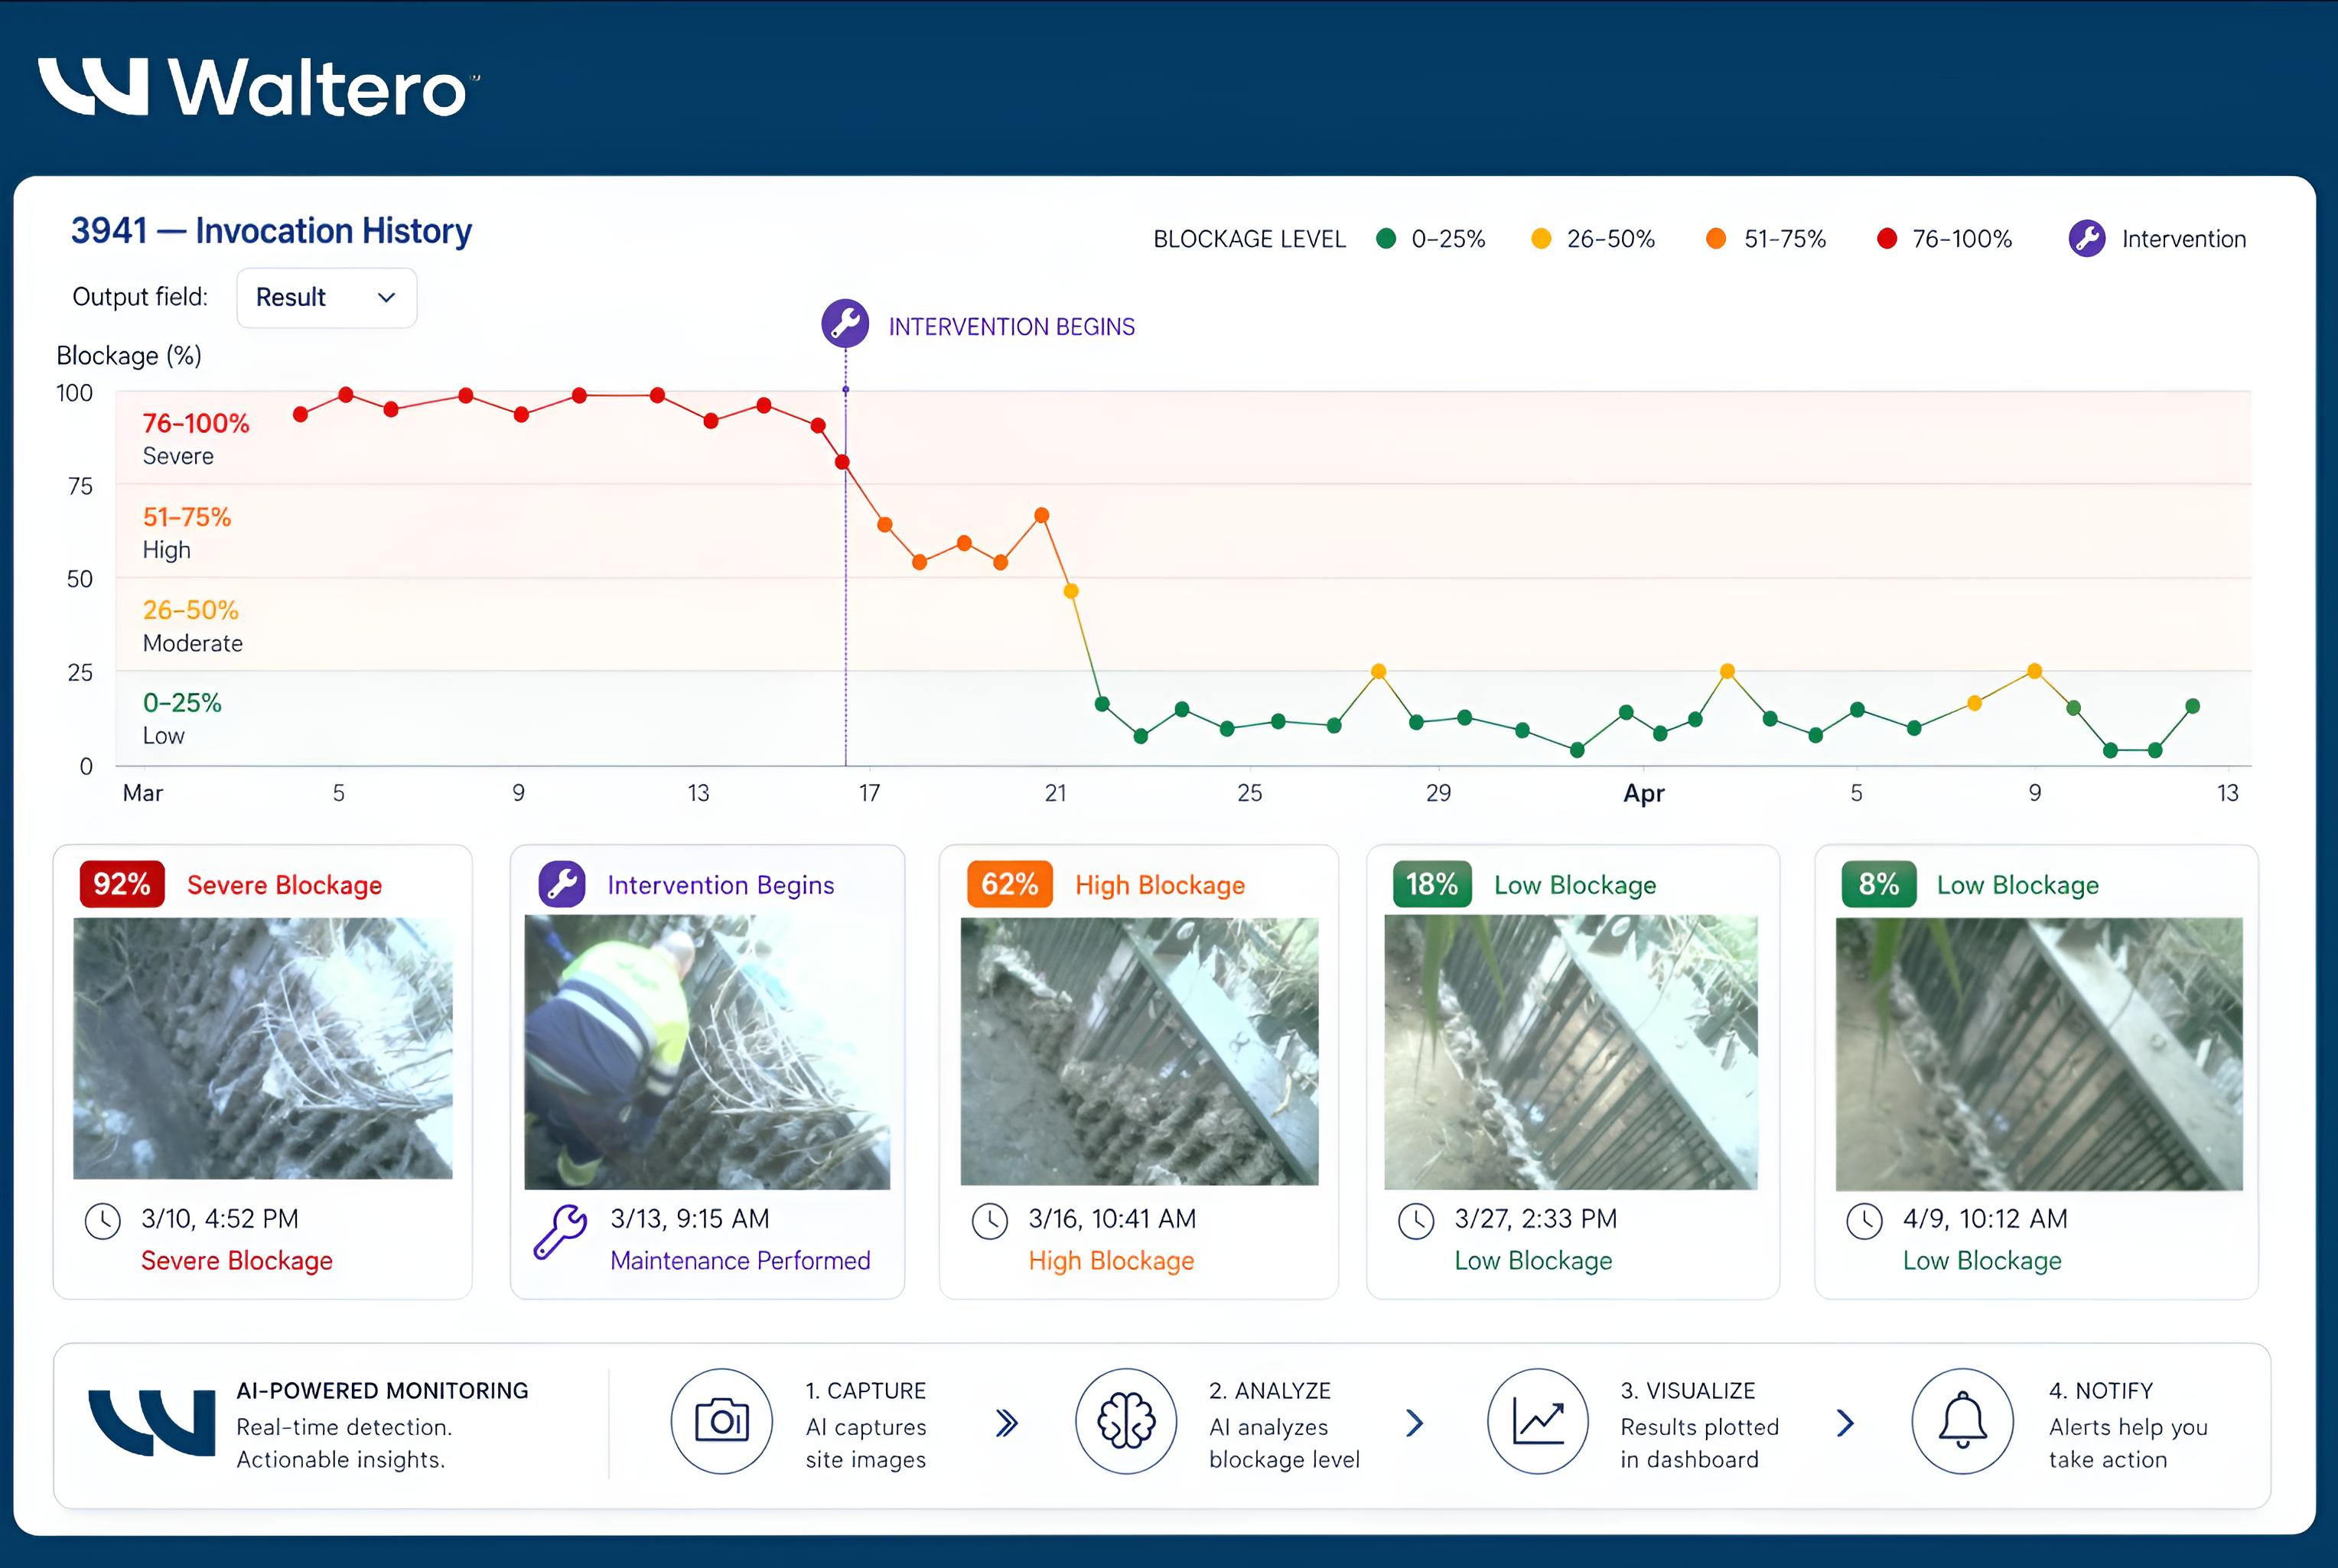
At Las Aseñas, the team watched a full operational lifecycle play out entirely through the platform — no field visit required: severe blockage detected → cleaning performed → medium blockage → no blockage confirmed.
That’s the shift. Not just finding problems earlier, but confirming the effectiveness of the response remotely — replacing verification visits with platform-based evidence of what actually changed.
From reactive to condition-based
Both deployments illustrate the same underlying change. Visibility stops being a function of how often someone shows up and starts being a function of what the sensor is seeing right now.
Instead of fixed inspection schedules and trucks rolling regardless of need, sensors report condition continuously and crews are dispatched only when conditions require it. Issues become visible as they develop rather than after failure, response times drop from days to hours, and labour scales with actual incidents rather than with asset count.
It’s a quiet but fundamental inversion of how utility operations are planned and budgeted.
Vision is just the opening chapter
Cameras answer the most visible questions: Is the grate blocked? Is the meter reading correctly? Is water flowing in the right direction? But the same device also bridges additional sensors via BLE, and carries accelerometer and audio pipelines that extend monitoring beyond the camera’s field of view — vibration on pumps, acoustic signatures on flow, moisture and temperature where they matter.
One device. One platform. A multi-modal picture of assets that, until recently, were almost entirely invisible between site visits.
Read the full white paper
This article adapts highlights from Waltero’s April 2026 white paper From reactive to predictive: how vision AI and multi-modal sensing are transforming how utilities monitor remote assets. Download the full paper for the complete case studies, deployment details, and technical architecture behind the Waltero platform.
Relevant to your operations?
We typically respond within 24 hours
%3Aformat(webp)&w=3840&q=75)


